A business receives two branch reports. One says that 90 percent of answered calls waited no more than ten seconds. The other reports a 90th percentile of 100 seconds. Averaging those values to 55 seconds feels like a sensible company-wide summary. It is usually the wrong calculation.
The error matters when a buyer compares an answering provider with an internal desk, combines locations, or renews coverage using a monthly dashboard. A percentile describes a position in a distribution. It is not an additive quantity. This brief explains the distinction with transparent constructed data and develops a reporting specification for live phone coverage.
What the technical source supports
The Prometheus guidance on histograms and summaries explains that precomputed quantiles cannot generally be aggregated, while compatible distribution representations can support aggregation. It also distinguishes the additive count and sum used to calculate a mean. Those mathematical properties apply beyond software monitoring.
The phone-reporting examples below are our application of those properties. They are not a description of AnsweringServiceStaff's reporting system, a promised response time, or measured customer performance. No provider-level percentile can be inferred from this illustration.
Work through a deliberately simple example
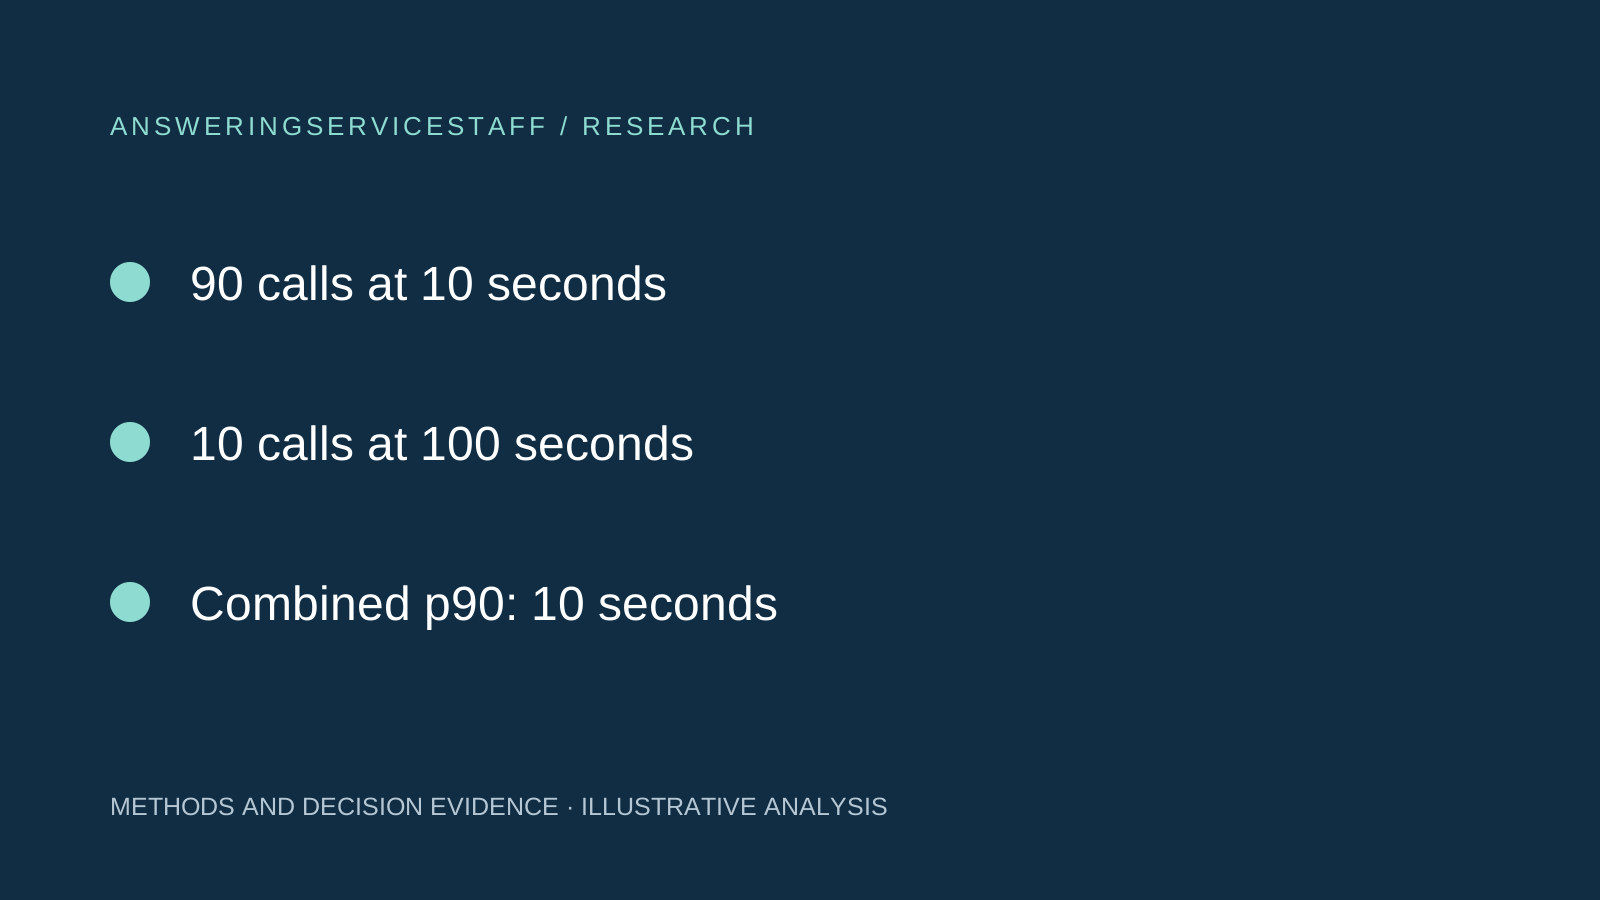
Assume Branch A answered 90 calls and every caller waited ten seconds. Branch B answered ten calls and every caller waited 100 seconds. Define the 90th percentile using the nearest-rank method: sort all observations and select the observation at the ceiling of 0.90 multiplied by the number of observations.
Branch A's 90th percentile is ten seconds. Branch B's is 100 seconds. Their simple average is 55 seconds. Weighting those percentiles by call count produces 19 seconds. Neither equals the combined 90th percentile.
Across all 100 calls, the first 90 sorted observations are ten seconds and the last ten are 100 seconds. The 90th observation is ten seconds, so the combined nearest-rank 90th percentile is ten seconds. Meanwhile, the combined mean is 19 seconds. The weighted calculation happened to recover the mean because every call within each branch had the same wait; it did not recover the percentile.
| Quantity in this constructed example | Seconds |
|---|---|
| Branch A 90th percentile | 10 |
| Branch B 90th percentile | 100 |
| Unweighted average of branch percentiles | 55 |
| Call-weighted average of branch percentiles | 19 |
| Combined nearest-rank 90th percentile | 10 |
Specify the quantile convention
Different software packages use different percentile interpolation rules. A report based on interpolation can produce a different value near a distribution boundary even when the underlying records are identical. That is a method difference, not necessarily a data error.
The reporting contract should identify the quantile convention, timestamp resolution, and rounding rule. Preserve precision through the calculation and round only for display. If the report labels a nearest-rank percentile as an interpolated percentile, a buyer may spend time investigating a discrepancy that is entirely explained by the method.
For small samples, include the count beside the percentile. A 99th percentile derived from 20 calls is heavily dependent on the largest observed waits and the selected convention. It should not imply the same evidential precision as a percentile from thousands of comparable calls.
Define the population being combined
A company-wide percentile is meaningful only after the population is defined. Does it include all offered calls, only answered calls, overflow calls, transferred call legs, or calls reaching a particular greeting? Each answers a different question.
For an answered-call wait percentile, keep unanswered calls in a separate outcome report. Excluding them from the wait distribution may be necessary because they have no answer time, but it must not make them disappear from the service assessment. A line can have a favorable answered-call percentile while many callers abandon before an answer.
Start the timer consistently. Time from entry into the business phone system differs from time after transfer to an external answering queue. Combining both under one field name creates a result that cannot support a fair provider comparison. The call-leg reconciliation study provides related context on defining events before calculating coverage measures.
Request records or compatible buckets
The most direct calculation uses one wait observation per eligible call, with identifiers that prevent double counting. A business does not necessarily need caller names or message contents to calculate this distribution. A limited export containing event identifiers, branch, period, disposition, and duration may be sufficient for the task.
If individual observations cannot be provided, ask for distribution buckets with the same boundaries and counting convention across branches. For example, cumulative counts at selected wait thresholds can be added across locations. The resulting distribution supports threshold reporting and an approximate percentile, depending on the bucket resolution.
Do not combine a branch report with buckets of zero to 15 seconds and another with zero to 20 seconds as if the boundaries matched. Rebinning may require assumptions that the original summaries cannot verify. Preserve uncertainty instead of manufacturing exact observations from coarse buckets.
Distinguish threshold compliance from percentiles
If the purchasing decision concerns a specific answer-time threshold, report the share of eligible calls meeting that threshold directly. Add the number meeting the threshold across branches and divide by the combined eligible count. This calculation is often easier to audit than a percentile.
Suppose the agreed analytical threshold is 30 seconds in the constructed example. Ninety of 100 answered calls meet it, giving 90 percent among answered calls. That statement is exact for the invented data. It does not establish performance among all offered calls unless the offered-call denominator and unanswered outcomes are also included.
A percentile and a threshold share can both be useful. They are different views of the same distribution when definitions match. Keeping both lets a reader recognize changes near a decision boundary rather than interpreting a rounded percentile as a complete account of caller experience.
Preserve branch visibility
A combined figure can be mathematically correct while concealing a poor experience at a small branch. In the example, the company-wide 90th percentile is ten seconds even though every answered call at Branch B waits 100 seconds. This is not a calculation defect; it is an aggregation limitation.
Keep branch-level results next to the combined distribution. If the contract requires a minimum service level at every location, assess that requirement for each location. A strong high-volume branch should not erase an unmet local requirement.
The same issue appears across hours and languages. Combining a large daytime queue with a small overnight queue may produce an attractive overall percentile while leaving the overnight problem intact. Select segmentation that follows operational responsibilities, then keep the definition stable enough to compare periods.
Check coverage before comparing months
A lower monthly percentile can result from missing a slow branch's records. Before interpreting improvement, reconcile expected locations, operating hours, call counts, and disposition categories. Ask whether any logging or routing change altered the population.
Late-arriving records also matter. State the reporting cutoff and whether subsequent records can revise the result. If one report is finalized after 24 hours and another remains open for a week, their apparent difference may partly reflect completion timing.
Compare the same call population across periods when assessing operational change. If the business opened a new location or changed its overflow rules, show that change explicitly. The combined metric remains descriptive, but attributing movement to the answering provider requires additional evidence.
What a buyer should require
For live call answering, request a report specification covering start event, end event, eligible population, unanswered outcomes, quantile method, aggregation method, and reporting cutoff. Ask the provider to reproduce one combined result from its underlying counts or records.
A useful acceptance exercise supplies a small known data set and checks the report's result. Include branches with unequal call counts, a few long waits, missing records, and duplicate call legs. These cases reveal whether the implementation is combining distributions or simply averaging dashboard cells.
This brief cannot tell a business what answer-time commitment to purchase. It can prevent a false comparison. A mathematically valid combined percentile, a visible unanswered-call denominator, and branch-level exceptions give the buyer a sounder basis for a coverage conversation than an average of impressive-looking percentiles.
Sources and review date
- Histograms and summaries — Prometheus. Checked 2026-11-07.