A business tests a shorter phone greeting and sees a higher booking percentage. Before changing every script, it should check a simpler number: how many eligible callers were assigned to each version? If the test was configured to split callers equally but the recorded groups are sharply unequal, the apparent improvement may reflect a broken comparison.
This brief applies sample ratio mismatch analysis to a controlled phone greeting test. The method is useful for businesses evaluating lead capture or appointment intake, but it is not evidence that a particular greeting works. All numerical examples are constructed. The objective is to detect problems that make a treatment comparison untrustworthy before interpreting its business outcome.
What the research establishes
Microsoft Research's explanation of sample ratio mismatch describes a mismatch between expected allocation and observed group counts as a diagnostic signal of data-quality problems. Its research paper on diagnosis organizes possible causes and investigation approaches.
Those sources concern online controlled experiments. Applying the diagnostic to phone operations is our inference from the same allocation logic. It does not imply that web experimentation procedures transfer unchanged to a call queue, where repeat callers, human delivery, and shared capacity can complicate the comparison.
State the planned allocation first
A mismatch can only be assessed against an expected ratio. A 50/50 design expects equal assignment probabilities, not necessarily exactly equal observed counts. An 80/20 design should be assessed against 80/20, not against equal groups.
Record eligibility and the allocation mechanism before the test starts. Specify whether the unit is a call, caller, account, or time block. Those choices affect both expected counts and statistical analysis. Randomizing callers but analyzing every repeat call as independent silently changes the experiment.
A greeting test also needs a reliable exposure record. Assignment to a script does not prove that the caller heard it, especially if a receptionist used a fallback greeting or the call disconnected. Preserve assignment separately from exposure so that a delivery problem does not rewrite the original group membership.
Calculate a transparent diagnostic
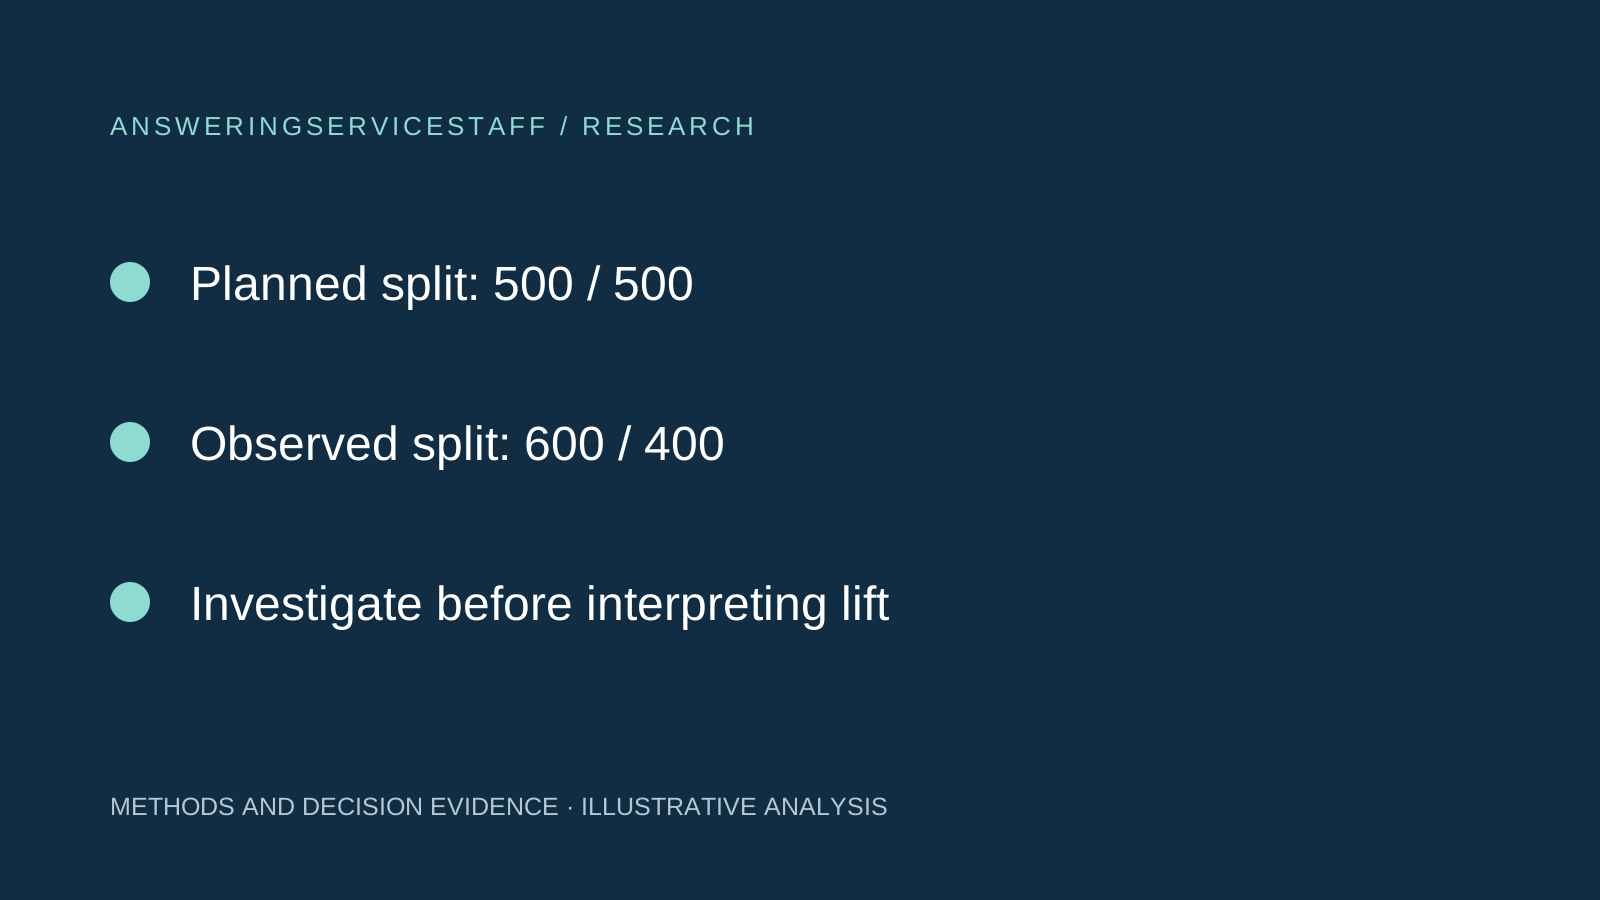
Suppose 1,000 independent eligible units are assigned with a planned 50/50 probability. The expected count is 500 in each group. The observed counts are 600 and 400.
A standard Pearson goodness-of-fit statistic sums squared observed-minus-expected differences divided by expected counts. Here it is 100 squared divided by 500, plus negative 100 squared divided by 500, giving 40. With two groups and a fully specified allocation, the reference chi-square distribution has one degree of freedom under the usual approximation.
The statistic is a strong warning under those assumptions, but the calculation does not identify the cause. It could reflect assignment failure, missing records, an incorrect eligibility filter, or a mistaken expectation. The correct response is investigation, not a declaration that one greeting attracted more callers.
Small differences are different. Counts of 510 and 490 give a statistic of 0.4 in the same setup. Random allocation naturally produces variation. A procedure that treats every unequal count as a defect will generate unnecessary alarms.
Separate assignment from downstream outcomes
An equal split of assigned callers does not require equal numbers of bookings. Booking is an outcome the greeting might legitimately affect. Testing the booking counts against 50/50 as if they were assignment counts would confuse treatment effects with allocation errors.
Similarly, if the shorter greeting changes whether callers remain connected long enough to complete intake, the counts of completed intakes may differ for a real reason. Restricting the analysis to completed intakes can select different populations in the two groups.
Keep the original eligible assignment denominator available. Show the sequence from assignment to exposure, connected conversation, completed intake, and booking. This makes it possible to identify where a discrepancy begins without assuming every later imbalance is a randomization defect.
Trace the first point of divergence
Start by reconciling assignment records against the independent call-entry records. If those totals differ, inspect missing identifiers, duplicate events, delayed ingestion, and exclusions. A downstream booking export cannot repair an incomplete assignment record by itself.
Next compare recorded assignment with actual script exposure. A fallback route may serve only one version, or a transfer may lose the original group label. An operator might manually choose the familiar script during busy periods. Each would undermine the intended comparison in a different way.
Then examine the analysis filters. An exclusion such as “complete messages only” may depend on behavior affected by the greeting. A language or operating-hours filter may also have been implemented differently across groups. Reconcile each step with counts rather than jumping directly to a conversion chart.
Use segments to diagnose, not to search for a win
A mismatch concentrated in one location, device route, shift, or language can narrow the investigation. Show the counts and expected ratio for each relevant segment, while retaining the overall view.
Segment analyses create their own multiple-checking problem. If a team inspects many small groups, some unusual counts will appear by chance. Choose diagnostic segments based on the system's architecture and the suspected failure, and interpret isolated warnings cautiously.
Do not respond to an unfavorable overall result by selecting the only segment where a greeting appears successful. Diagnostic segmentation asks where the records became unreliable. Outcome subgroup analysis asks a different question and needs its own prespecified rationale and uncertainty assessment.
Handle repeated callers deliberately
A repeat caller may hear both greetings if allocation occurs independently on each call. That can be acceptable for some operational questions, but it changes what the experiment estimates. Prior exposure can influence later behavior, and repeated records from one caller are not independent people.
Persistent assignment can reduce crossover, provided the identifier is reliable and appropriate for the purpose. A shared telephone number is not always one person, and withheld caller ID can complicate matching. State the limitation rather than claiming perfect caller-level randomization.
If allocation occurs by shift or time block, analyze the block design. A thousand calls spread across a few randomized shifts do not provide a thousand independent assignment units. Time-based workload changes and staff differences can dominate a small experiment.
Avoid repairing results by deleting inconvenient records
Removing enough records to restore a 50/50 split does not fix a broken experiment. Neither does reweighting the groups automatically make the missing observations harmless. The defect may be related to the outcome in ways that the available data cannot reconstruct.
If the cause can be corrected and all relevant records recovered, rerun the analysis with a documented correction. If reconstruction is not reliable, treat the result as inconclusive and plan a clean restart. Preserve the original evidence so that the same failure can be prevented.
A mismatch diagnostic is a gate on interpretation, not an outcome optimization tool. Passing it also does not prove that the experiment is valid. Balanced logging can still contain wrong timestamps, inconsistent booking definitions, or contamination between scripts.
Connect the test to a business decision
For lead capture, specify the decision before collecting data: whether to adopt a greeting that improves a defined outcome without worsening important guardrails. Possible guardrails include unresolved requests, call duration, and complaints, but the business should choose those that matter for its workflow.
Set the analysis window, outcome maturity period, and stopping rule in advance. Do not declare success whenever an interim chart happens to look favorable. The multiple-comparison research discusses a related risk when teams examine many candidate measures.
The result should distinguish assignment integrity, script delivery, and estimated business effect. A technically clean split with an imprecise booking difference may still be inconclusive. That is a useful finding when it prevents a weak result from becoming a permanent process change.
What this method can and cannot establish
A sample ratio check can expose an important class of defects early. It cannot tell the business why callers booked, guarantee unbiased estimates, or compensate for a test too small to answer the decision.
Before a coverage consultation, bring the proposed script variants, assignment unit, expected split, eligibility rule, and outcome definition. A provider can then discuss whether the operating workflow can support a credible comparison. The purchasing lesson is simple: trustworthy evidence begins with knowing who entered each group, not with celebrating the final conversion percentage.
Sources and review date
- Diagnosing Sample Ratio Mismatch in A/B Testing — Microsoft Research. Checked 2026-11-07.
- Diagnosing Sample Ratio Mismatch in Online Controlled Experiments: A Taxonomy and Rules of Thumb for Practitioners — Microsoft Research. Checked 2026-11-07.